DRONE TECHNOLOGY STUDY
Recent incidents of avian influenza and virulent Newcastle disease have placed a growing impetus on implementing biosecurity programs and ways to improve biosecurity. Here, we explore how unmanned aircraft systems (i.e., drone) technology can be used to enhance a biosecurity program. We provide real-life examples of how drones are capable of providing high quality images at various altitudes and perspectives that allow delineation of parameters such as lines of separation, perimeter buffer areas and traffic flow. Additionally, risk factors can be readily identified within a facility (e.g. bird nests in rooftops) and external to a facility (e.g. those areas that attract waterfowl). We also explored using thermal sensing to reveal and expose what was not routinely observable. In summary, drone technology may prove to be a useful tool for enhancing biosecurity programs.
Materials and methods
Small unmanned aircraft (sUAS) enabled with multisensor platforms, such as combined thermal imaging with finescale visual imagery, were used to assist in biosecurity decision-making at the producer level. The focus was to develop an initial candidate protocol that could be used to guide deployment of unmanned aircraft to assist and enhance biosecurity in real-world situations. Although the approach differed with different operations, the approach involved a multi-tiered strategy, leading to a recommended protocol.
All sUAS flights were conducted as commercial flights within the context of FAA Part 107 regulations, by pilots who have current Part 107 certificates.
- All sUAS flights were conducted within the guidelines defined in the University of Nebraska Policy on Unmanned Aircraft, and under suitable weather and site conditions.
- Onsite project participants were informed of the sUAS component of the Big Red Biosecurity project, and their permission was secured prior to flight activities.
- Data and information obtained at each site were shared with each participant associated with the given site, and archived in a secure protected repository.
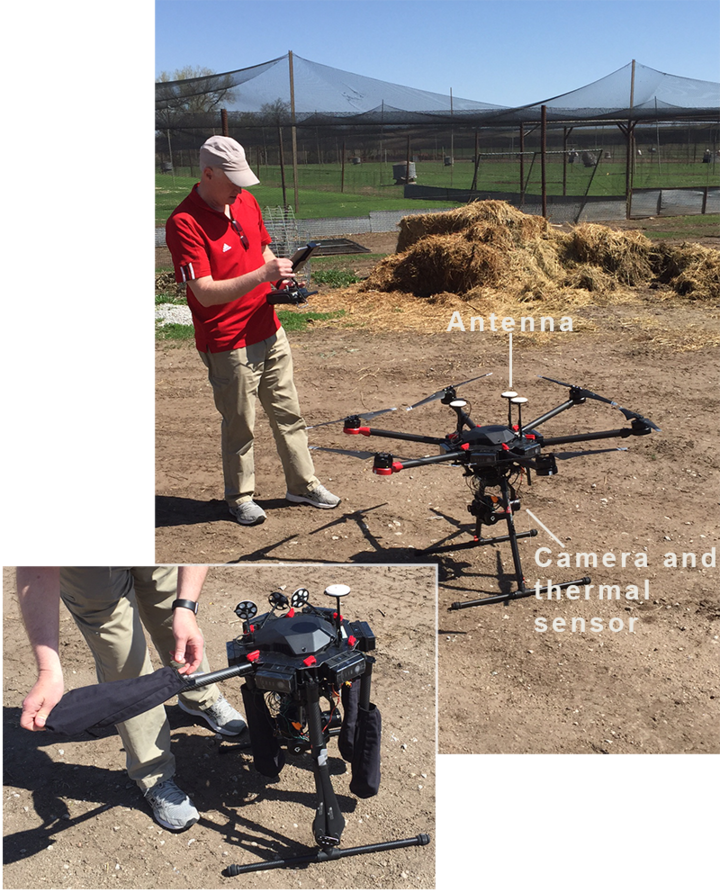
- A FLIR Duo Pro 640/R/13mm lens thermal sensor, mounted on a Gremsy T1 gimbal, and fitted onto a DJI Matrice 600 sUAS was used (Figures 1, 2a and 2b). This sensor provided both visual and thermal data streams for subsequent analysis.
- Appropriate altitudes and along predefined flight paths as part of the protocol. This was done numerous times to refine the protocol.
- Gathered data was processed into actionable information that was used to guide biosecurity decision-making as a component of the Big Red Biosecurity Program.
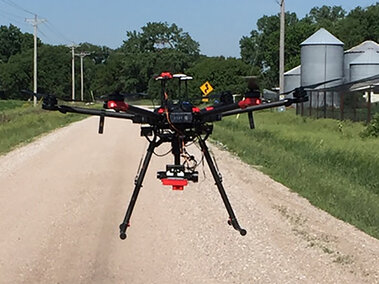
Figure 2a. At takeoff the landing gear is down.
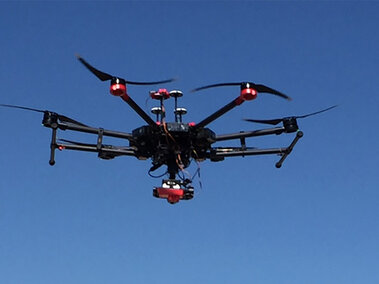
Figure 2b. The landing gear folds up during flight, allowing the camera a 360-degree unobstructed view.
Figure 2b. The landing gear folds up during flight, allowing the camera a 360-degree unobstructed view.
Results/discussion
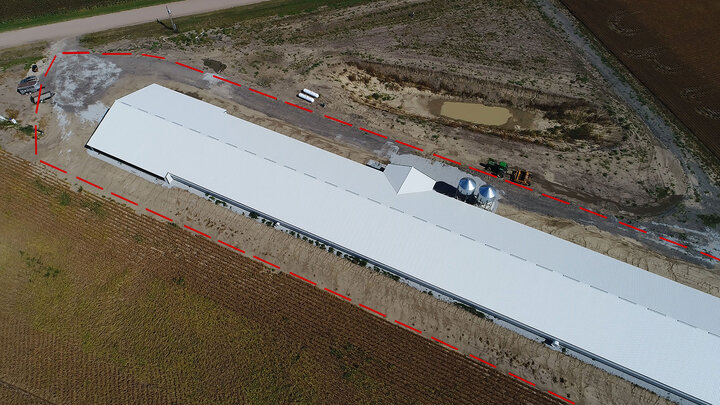
Having an up-to-date, high quality, accurate aerial view of an operation is often either required or highly recommended for poultry biosecurity programs. Such views allow for identifying risk factors, locating points of entry, delineating lines of separation (LOS), defining the perimeter buffer area (PBA), directing vehicular traffic flow, etc. Figure 3 from operation 1 is an aerial view of a commercial operation in which the poultry building and surrounding area are easily observed. From this image the lines of separation (LOS, i.e., building walls) and the entry system can be identified. The perimeter buffer area (PBA) is illustrated by digital labeling and has no physical presence. However, in case of a high threat level (such as avian influenza) a physical structure (such as a fence) could be quickly erected.
Figure 4a is an aerial view of a gamebird operation in which there are both buildings and outside pens for rearing birds. Figure 4b is the same image which has been labeled digitally. The labels not only provide for easy identification of the buildings and pens but also provide for LOS (yellow) as described in NPIP’s biosecurity principles and the potential for a PBA (red) if needed.
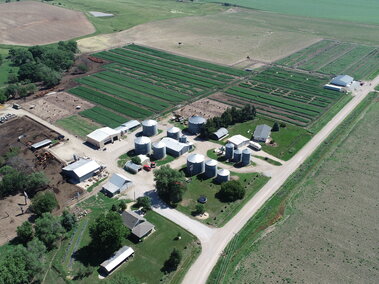
Figure 4a. Aerial view of a gamebird operation.
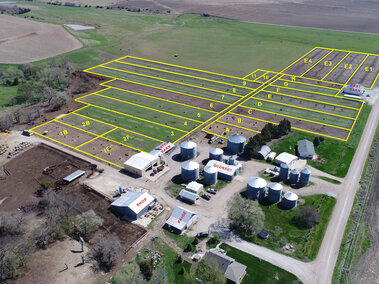
Figure 4b. Flight pens, facilities and traffic paths are added digitally, providing the operator with a monitoring and training tool.
Figure 5 is a higher altitude (approximately 400 feet above ground) panoramic “snapshot” view of the horizon that was taken from a 360 degree video of operation 1. Note the isolation and absence of risk factors such as standing water, waterways and traffic routes. A small town can be seen in the distance and is approximately three miles away. The crops that are evident can at times harbor wild birds and should be considered as risk factors at certain times of the year, such as fall harvest).
Figure 6 is a higher altitude (approximately 400 feet above ground) panoramic “snapshot” view of the horizon that was taken from a 360 degree video of operation 2. In less than a quarter of a mile one can observe risk factors including ponds, streams and a known migratory flyway for waterfowl. Additionally, there are residences, cattle operations and much vegetation along with agricultural crops in the proximity.
Figure 7 is a low altitude image of the facilities in operation one. Note how the drone provides views that otherwise would be difficult to obtain.
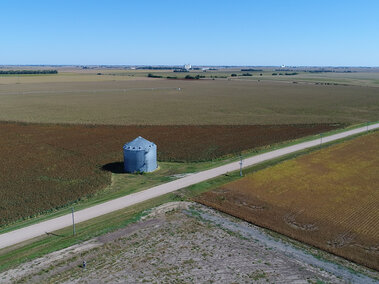
Figure 5. An aerial view from 400 feet shows the fields that border a commercial operation. This view reveals an absence of risk factors in the immediate vicinity.
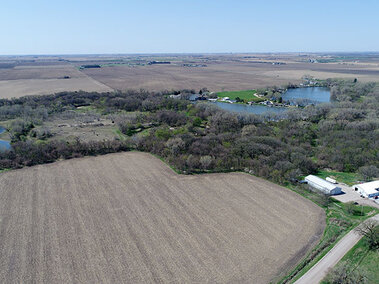
Figure 6. An aerial view taken at 400 feet above a gamebird operation shows potential risk factors including ponds and streams.
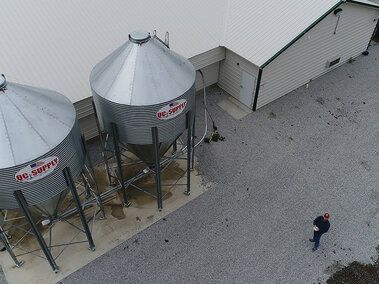
Figure 7. A low altitude view of a poultry barn at a commercial operation.
Figures 8a and 8b are images taken of operation two of birds in a flight pen. Figure 8a is a high quality photograph in which birds can be seen in open areas and in the vicinity of the feeders. Figure 8b is an image obtained by the thermosensor camera unit on the drone. The white specs indicate live birds. Note that the live birds (white specs) present in the vegetation are not visible in Figure 8a.
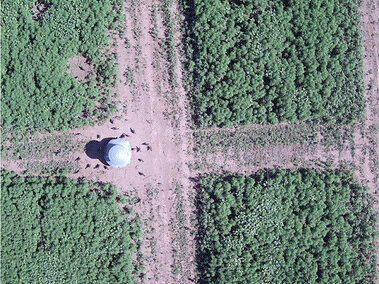
Figure 8a. The drone captures an image of a flight pen at a commercial gamebird operation.
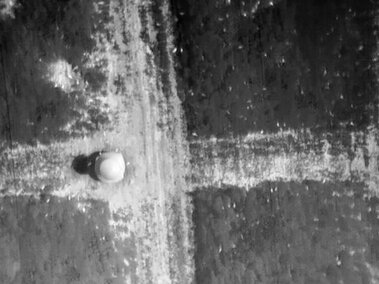
Figure 8b. The same view as Figure 8a but taken with thermosensor camera unit attached to the drone. Here, temperature differences indicate live birds (white specks) are hidden in the vegetation
Acknowledgements
The development of the Big Red Biosecurity Program for Poultry was supported in part through a grant from the USDA Poultry Respiratory Disease Coordinated Agricultural Project (PRD-CAP).